In 1981, USDA researcher Dr. Ray D. Jackson, also known as USDA’s Father of Remote Sensing because he developed methods used worldwide to evaluate crop health, determined that the difference between a plant’s canopy temperature to air temperature (Tcanopy – Tair) depends on vapor pressure deficit. Under non-limiting water conditions, healthy plants transpire at the maximum rate. Maximum evapotranspiration increases with increasing vapor pressure deficit. When plant health and water availability is not limiting there is a linear relationship between Tcanopy – Tair and vapor pressure deficit.
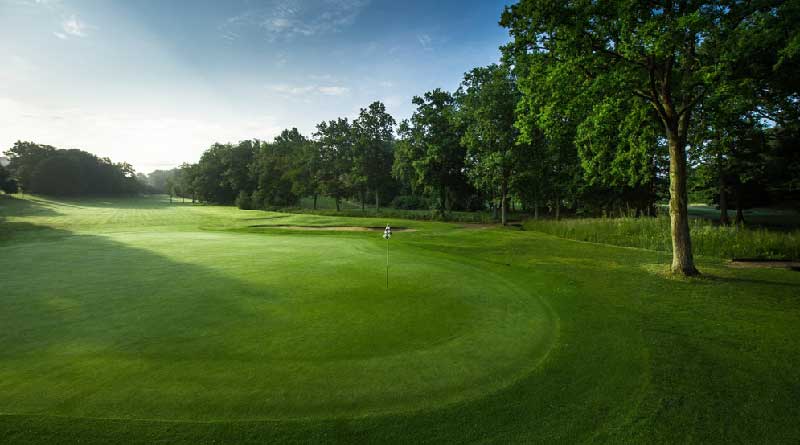
Figure 1. Air and Turf Temperatures in a section of fairway.
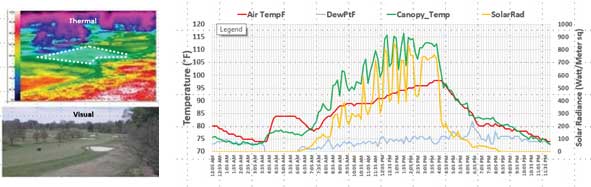
Jackson called this linear relationship the theoretical ‘non-water-stressed baseline’ and used the idea of upper and lower baselines, to create a crop water stress index (CWSI). This CWSI allows one to relate a crop’s temperature to the maximum and minimum values of stress that the plant can experience under similar environmental conditions. The higher the CWSI, the greater the crop stress is assumed to be. It has since been shown that thermal image data make it possible to measure turf canopy temperature, pair it with air temperature measured by a local weather station, and measure daily upper and lower canopy temperature limits to inform a Stress Index. The turf’s canopy temperature is the biotic integrator of the air temperature, humidity, pressure, water availability, wind, solar intensity, and sky conditions which contribute to the turf’s health and water status. Stress values can be calculated over designated areas from an image frequently. From individual images this is known as the Image Stress Index. The Daily Stress Index is the average of the Image Stress Indexes from sunrise to sunset.
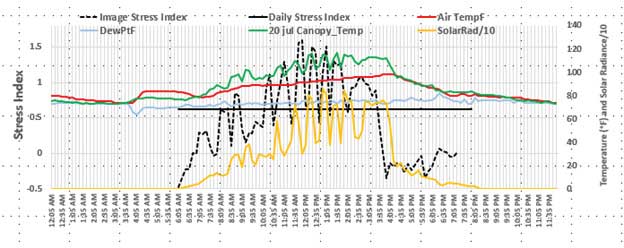
Figure 2. Image Stress and Daily Stress in a section of fairway.
There are two signals that can be obtained from thermal image data of the canopy.
First, an examination of the video stream/time series of images, day and night, will highlight health and stress locations and show (not measure) soil moisture. Secondly, persistent Daily Stress Indexing make it possible to assess stress and turf water status. If the turf is found to be disease and pest free an elevated Daily Stress Index will signal the turf needs water.
In 2003, Drs. Douglas Karcher and Michael Richardson showed that an analysis of digital visual images provide a reliable method to measure the reflectance of color from vegetated surfaces and that the color can be measured and expressed as the hue degree.
Figure 3. hue degree color wheel
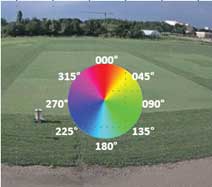
By establishing an area of interest and then averaging the measured hue values in each of the visual image pixels an average hue and the standard deviation of the hue in that area can be determined.
The signals obtained from visual image data of the canopy hue infer chlorophyll content and its standard deviation gives a measure density/homogeneity of the turf. Taken together these values describe quality. They comprise a Quality Index.
Figure 42. Hue and Std Dev of Hue in a section of fairway.
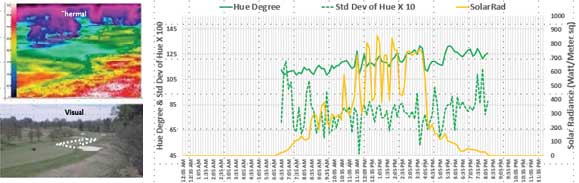
When paired with the Stress Indices over the period of several days the change of the Quality Index will significantly contribute to the assessment of plant health. A stable hue and a low standard deviation (high degree of uniformity) not only represents high quality but also confirms low thermal stress assessments. Low quality (wandering hue and large standard deviation of the hue) usually follow consecutive days of high stress.
When measuring turf for identification of stress, quality, and water status; persistent measurements are essential because the turf is continuously transpiring and respiring in a dynamic environment (see figures 1 & 2). Settling on any one image for a scouting report or for indexing turf may lead to poor conclusions regarding actions needed.
Irrigation Indexing is possible by evaluating and tracking the Daily Stress Index and Quality Index. The daily call for irrigation is signaled when the Daily Stress Index value exceeds a threshold established and indicates it needs water. When the Daily Irrigation Index crosses the turf’s threshold that day, irrigation is applied in a predetermined amount. The Index threshold and water amount applied is a constant that is specific to the location and is based on a typical amount of irrigation that might be applied. Daily Irrigation Index measurements continue every day. If the next day the Irrigation Index crosses the threshold, water is applied again. The goal is to put water into the root zone, then irrigate again when called for and not until. There are periods where the Irrigation Index may call for irrigation two or three days in a row or it could go six or more days before water is called for by the turf.
The daily irrigation guidance is checked by evaluating the Quality Index at solar noon. With respect to the signal to irrigate, the greatest weight is given to the Daily Stress Index. But when the quality is seen to wander, i.e. the standard deviation is growing and/or the hue is changing, a close examination of the turf is needed. This check is important because too little irrigation may not be the cause of decreased quality. When there have been long periods of rain, cool air temperatures, and frequent cloudy sky conditions, it is important to look closely for disease rather than adding water if the Daily Stress Index measures high.
Using remote sensing for managing turf is complex and requires large amounts of image data measurements and calculations, 24/7/365. Systems that collect, measure, and calculate autonomously, such as a Hawk-Eye™ or an EYAS System used by Turf-Vu can make actionable alerts so that users of the system can go about their business and be alerted when there is something requiring attention.
Jim Etro is the developer of the Hawk-Eye™ and its smaller sibling the EYAS Systems. Both see and measure the turf to give it a voice.


